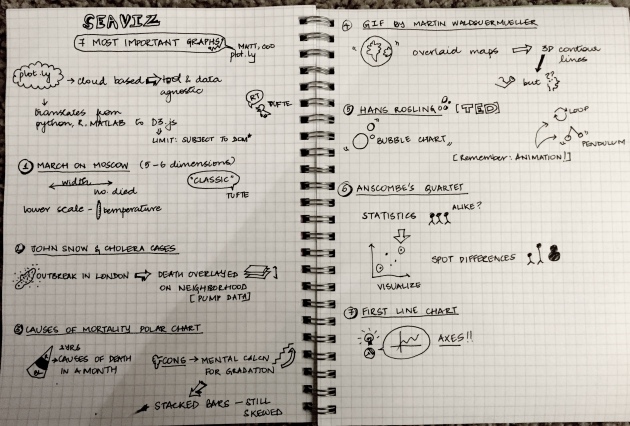
When I went to the Seattle Data Viz meetup today, I had 2 objectives:
1. To get some interesting inputs on the ‘Top 7 graphs’
2. To try Sketchnoting, just to build my skills in the area
I skipped the entire second half of the conversation because it focused almost entirely on plotly features, which were pretty cool but not my area of focus. For students / startups, I think they offer a very cool solution to experiment and collaborate on creating some of these.
My notes are kinda sparse because there wasn’t much discussion on the graphs themselves (which was what I was expecting). Ah well, 1/2 objectives ain’t too bad. So anyway, check out my Sketchnotes, and let me know what you think. I hope to do more soon (and maybe buy some more pens to add some dimensions to these!).
